REMOTE SENSING
most of the contents of this webpage have been lifted from my end of semester review notes
more formal text to come...
to a geographer, the internet is a challenging object of inquiry . . . the web flattens the intuitive experience of space while its users and infrastructure still have a measurable position in the real world
this project attempts to parse this dissonance by asking:
how can we measure digital connectivity as it relates to a physical world?
where are the furthest corners of the internet?
where are the furthest corners from the internet?
how can we listen to the mechanisms that determine access?
I could conceive of connectivity like Barrett Lyon - his map of the internet presents a network topology of nodes and edges (or portals and linkages) that define its virtual quote-unquote “space.” But this type of spatiality is defined more through metaphor than felt experience. As a 'spatial scientist', I prefer to think about this much more literally:

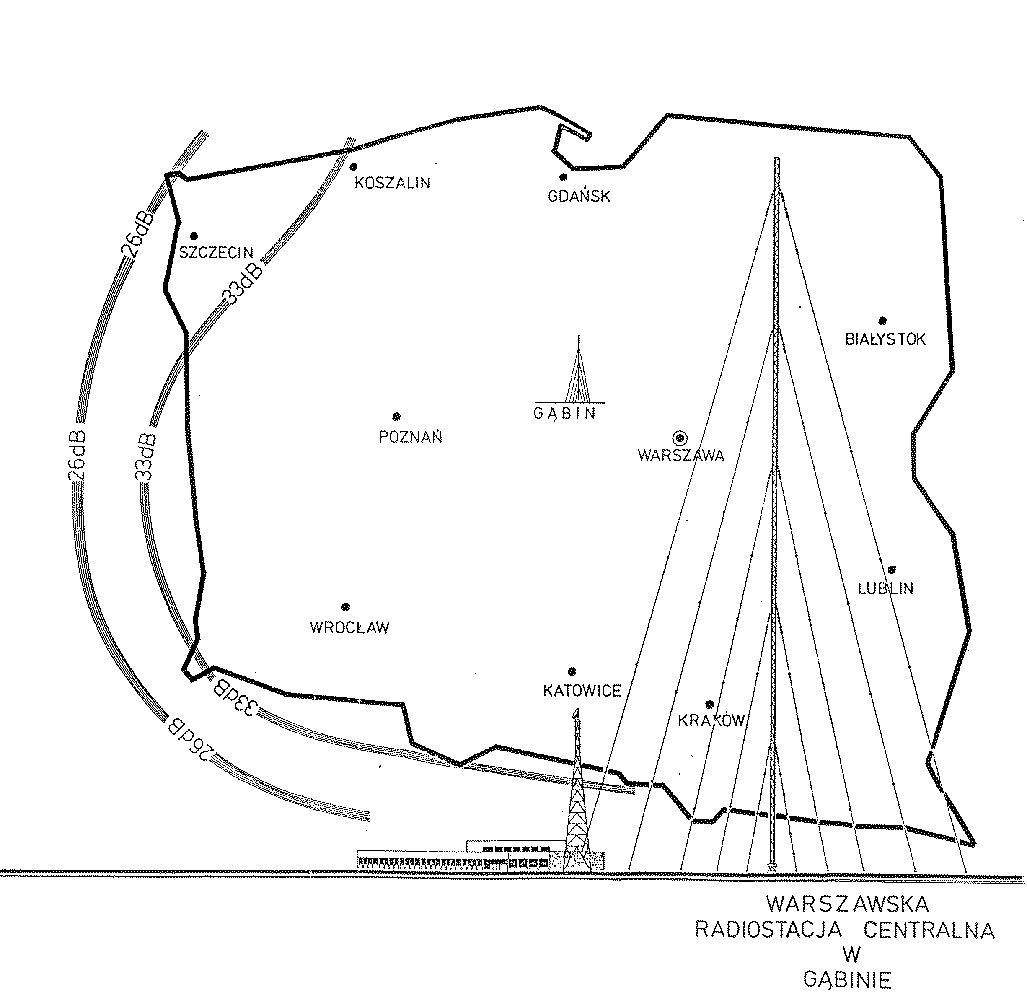
FM RADIO TOWER LOCATIONS AND THEIR SIGNAL PROPAGATION CURVES
this is from a project I worked on over the summer in colloquium i -
Using US Federal Communications data, I extracted imagery from FM radio transmitters, as well as the estimated propagation distance of each transmitter signal. One can clearly see the relationship between the landscape and shape of each signal contour
I find that phenomenon of electro-physical interference compelling, so I’m digging in
point of entry
pictured : an old hunting camp built by my grandpa in the adirondack mountains
until recently, there has never been an internet connection anywhere nearby
cell service is still largely nonexistent within a couple miles’ drive, but we put a landline broadband hookup there a couple years ago
i have a complicated relationship with this newfound connection: i lost my ability (and excuse) to definitively sign off for a while, but it’s enabled more visits with flexible work arrangements . . . etc . . .
i still leave my phone in the car once i arrive
proof of concept
As an exploratory exercise, and to wireframe potential interface design for my final output, I’ve been developing a three dimensional mapping browser-based application to place built cell and radio topology in the context of the physical landscape.
New York State is my primary study area
Nearest-neighbor connections give a sense of cardinality for these line of sight dependent propagation signals
Lines of sight are fundamental to this modeling methodology
I’ve estimated potential cell phone dead zones to highlight areas of interest for later investigation
This was part proof of concept, part data explorer tool, mostly a learning exercise: figuring out how to reproject 2D geospatial data,
which I’m used to working with, into a three dimensional space where signals propagate in all directions
click the 'fullscreen map' button, bottom right, to explore
form factor
i make maps for a living, but they’re are about as conventional as they come, out of necessity: GIS input, output to PDF, print on a plotter, send to the field
for my capstone i’m eager to envision new methods of describing geographic information - specifically one that de-emphasizes the visual in favor of other sensory perspectives.
ideally, too, my map-as-instrument would encourage discovery and play
I spend quite a bit of my free time tinkering with electronic instruments in my studio, often soldering my own, so incorporating that ethic into my cartographic practice is an exciting opportunity.
This is also informed by my experience writing music first with virtual instruments and eventually being able to afford tactile interfaces. There is definitely a difference in the experience and output.
Likely the platform for this map will have a similar form factor to a GPS receiver (or etch-a-sketch) and will be raspberry pi or arduino based: I feel strongly about having a sort of “artifact” to hold and interact with


central and remote
The US department of agriculture bins zip codes into four increasing intensities of “FAR” (frontier and remote, ha!)
depending on their distance from high-order specialized (level 1) to low-order necessary (level 4) goods and services
this includes
- emergency services
- places of commerce
- transport hubs
signal erosion
I am applying the same logic that defines physical accessibility to explore electromagnetic signal as an electronic shadow.
(Ironically I’m calling these literally analog waveforms “digital” in this case)
These signals use the earth as transmission substrate, either directly via lines of sight (their viewshed) or passively through the soil or ionosphere. The same physical phenomena that affect FM radio also affect cell signal.
Radio signal - and signal loss - is thus a useful proxy to operationalize and investigate electronic isolation
signal: sightlines
Drawing inspiration from my earlier terrestrial radio experiments, I’m most interested in signals that propagate through the air and how their signals decay or interfere with one another
Plus, there isn’t a ton of complete reporting done on cell dead zones, since the FCC allows telecomms to self-report and then uses those reports to make their coverage maps. Networks will model their network coverage based on perfect physical conditions on the ground
for reference, relative propagation distances per cell frequency band:
- 2G (~50km)
- 3G (~30km)
- 4G (5-15km)
- 5G (1-3km)


signal: landlines
Broadband access is of course fundamental to digital accessibility
Since this signal travels through hard wires, its transmission properties are much more easily monitored. Therefore, spatial coverage is well documented, like in this data explorer tool created by the new york state Public Service Commission
nys Public Service Commission 2023
signal: extraterrestrial lines
another dimension worth noting is connectivity via satellite
In addition to GPS and television constellations, EUTELSAT ONEWEB AND SPACEX STARLINK operate in the broadband domain
Their orbital positions are available via NORAD
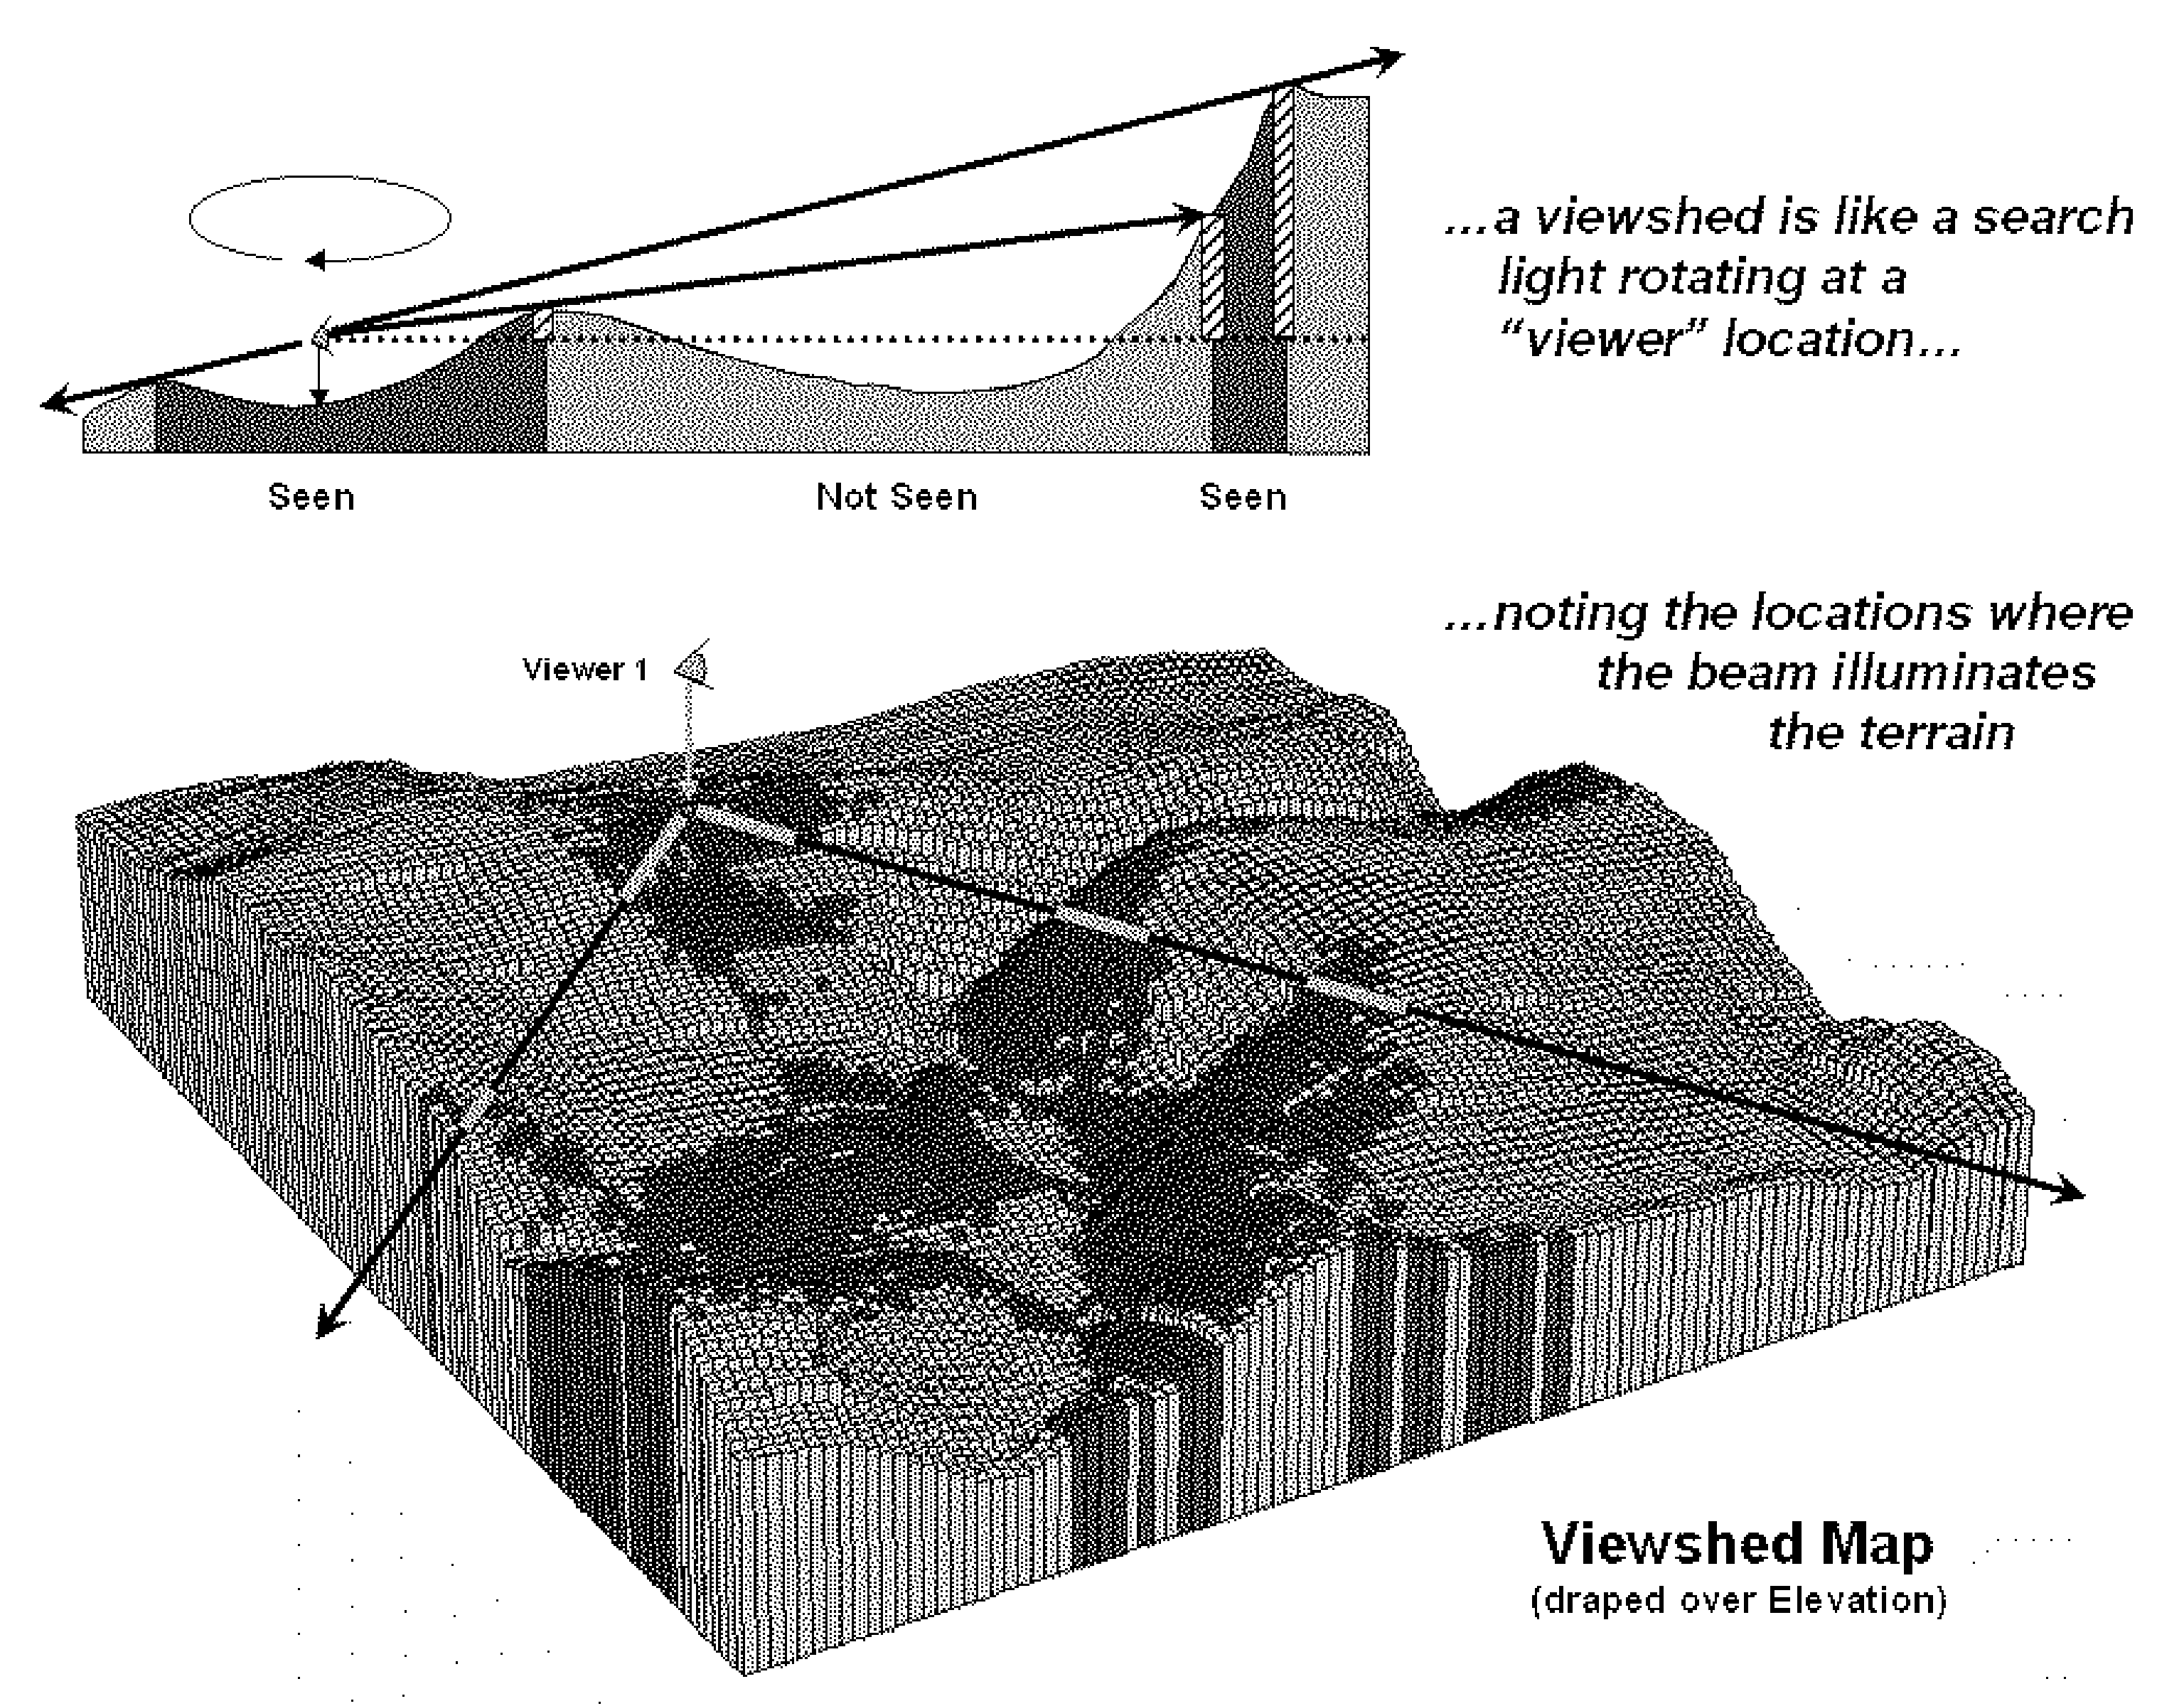
lines of sight
cell signals use the earth as transmission substrate, either directly via lines of sight (viewshed) or passively through the soil or ionosphere.
The same physical phenomena that affect FM radio also affect cell signal.
Radio signal - and signal loss - is thus a useful proxy to operationalize and investigate electronic isolation
one method of roughly modelling megahertz level signal propagation is through a viewshed analysis.
by placing a cell network in 3d space with a digital elevation model (DEM), one can estimate a receiver's signal on the ground
cell signals technically can penetrate solids, but there is immediate signal absorption and refraction
this technique can be used to visualize cellular network catchment areas

sonification
since my phenomena of interest - sound + signal - are physically waves there is a surprising amount of semantic overlap
for example:
- Sonic and electromagnetic waves reflect and refract similarly, so sound propagation models may be helpful
- Amplitude modulation (AM, like the radio) and frequency modulation (FM) are critical to radio signal propagation
as well as common methods to modify a sonic palette.
In both contexts, there are fundamental “carrier” waves that are affected by an external “modulator” waveform
- Signal strength measured in decibels (just like loudness level on a stereo)
- Wave interference between competing bands produces eerie and unique audio fingerprints
- noise is decoded by signal receivers in similar ways - think about white noise static

(VICKERS & HOGG, 2006)
sound, signal, terrain
“wavetables” are quasi-periodic sound-shapes that can be navigated through at high frequencies to produce distinctive sonic timbres - mountains of signal
a sonic map could reverse engineer the concept to decode physical landscapes through sound
precedents
plenty others have explored the similarities between musical composition, performance, and the science of transmission. There is a rich precedent in the “transmission arts,” but it typically refers to terrestrial radio transmission
i'd like to take it a step further and examine other modalities of transmission: cellular, wifi, bluetooth
alternative semiotics
the map as instrument is not a spatial chopping block
I hope to try and subvert the ingrained behavior of the map as a tool for creating and perpetuating arbitrary divisions in space
For instance, analog radio propagation signal contours don’t represent a harsh dropoff of signal, but rather the range without signal interference.
I’m trying to think about sound, signal values, and space in terms of interfering wave patterns.
Compared to the continuity of signal waves, Digital signal receivers have a cardinality: the device is linked to one and only one signal.
Treating the map user as a signal receiver, my map will have a method of sonifying this switching mechanism which would be difficult to understand visually.
some things to think about:
- a place’s audio fingerprint vs arbitrary lines
- interfering signals vs. binary dropoffs
aka continuous gradients
- + rhythmic oscillations vs discrete edges